Metrics
Introduction
The metrics handler collects the API runtime information and reports it periodically to a time series database like Influx or TimeScale (5 minutes to 15 minutes, based on the API volume). Basically, the light-4j metrics module will push the metrics info to a remote server. At this moment, we have two implementations: [InfluxMetricsHandler][] and APMMetricsHandler.
At the same time, some of the metrics servers will pull the metrics info from the light-4j metrics module like Prometheus.
The metrics server might use Grafana to display the metrics dashboard from two different perspectives:
Client-oriented - client-centric info to show how many APIs to call and each API runtime info.
API-oriented - API-centric info to show how many clients call this API.
Configuration
Here is the default metrics.yml that covers all different type of metrics handlers.
# Metrics handler configuration that is shared by all the push metrics handlers.

# If metrics handler is enabled or not. Default is true as long as one of the handlers is in the
# request/response chain.
enabled: ${metrics.enabled:true}
# If metrics handler is enabled for JVM MBean or not. If enabled, the CPU and Memory usage will be
# collected and send to the time series database.
enableJVMMonitor: ${metrics.enableJVMMonitor:false}
# Time series database server protocol. It can be http or https. Others can be added upon request.
serverProtocol: ${metrics.serverProtocol:http}
# Time series database or metrics server hostname.
serverHost: ${metrics.serverHost:localhost}
# Time series database or metrics server request path. It is optional and only some metrics handlers
# will use it. For example, the Broadcom APM metrics server needs the path to access the agent.
serverPath: ${metrics.serverPath:/apm/metricFeed}
# Time series database or metrics server port number.
serverPort: ${metrics.serverPort:8086}
# Time series database name.
serverName: ${metrics.serverName:metrics}
# Time series database or metrics server user.
serverUser: ${metrics.serverUser:admin}
# Time series database or metrics server password.
serverPass: ${metrics.serverPass:admin}
# report and reset metrics in minutes.
reportInMinutes: ${metrics.reportInMinutes:1}
# This is the metrics product name for the centralized time series database. The product name will be
# the top level category under a Kubernetes cluster or a virtual machine. The following is the light-4j
# product list. http-sidecar, kafka-sidecar, corp-gateway, aiz-gateway, proxy-server, proxy-client,
# proxy-lambda, light-balancer etc. By default, http-sidecar is used as a placeholder. Please change it
# based on your usage in the values.yml file.
productName: ${metrics.productName:http-sidecar}
# A flag to indicate if the scope client id will be sent as a common tag. If it is true, try to retrieve
# it from the audit info and send it if it is not null. If it does not exist, "unknown" will be sent.
# By default, this tag is not sent regardless if it is in the audit info. You only enable this if your
# API will be accessed by a Mobile or SPA application with authorization code flow. In this case, the
# primary token is the authorization code token that contains user info and the secondary scope token
# is the client_credentials token from the immediate caller service in the invocation chain.
sendScopeClientId: ${metrics.sendScopeClientId:false}
# A flag to indicate if the caller id will be sent as a common tag. If it is true, try to retrieve it
# from the audit info and send it if it is not null. If it doesn't exist, "unknown" will be sent.
# By default, this tag is not sent regardless if it is in the audit info. The purpose of this tag is
# similar to the scopeClientId to identify the immediate caller service in a microservice application.
# As the scopeClientId is only available when the scope token is used, it cannot be used for all apps.
# light-4j client module has a config to enforce all services to send the callerId to the downstream
# API, and it can be enforced within an organization. In most cases, this callerId is more reliable.
sendCallerId: ${metrics.sendCallerId:false}
# A flag to indicate if the issuer will be sent as a common tag. If it is true, try to retrieve it
# from the audit info and send it if it is not null. If it doesn't exist, "unknown" will be sent.
# By default, this tag is not sent regardless if it is in the audit info. This tag should only be
# sent if the organization uses multiple OAuth 2.0 providers. For example, Okta will provide multiple
# virtual instances, so each service can have its private OAuth 2.0 provider. If all services are
# sharing the same OAuth 2.0 provide (same issuer in the token), this tag should not be used.
sendIssuer: ${metrics.sendIssuer:false}
# If issuer is sent, it might be necessary to extract only partial of the string with a regex pattern.
# For example, Okta iss is something like: "https://networknt.oktapreview.com/oauth2/aus9xt6dd1cSYyRPH1d6"
# We only need to extract the last part after the last slash. The following default regex is just for it.
# The code in the light-4j is trying to extract the matcher.group(1) and there is a junit test to allow
# users to test their regex. If you are using Okat, you can set metrics.issuerRegex: /([^/]+)$
# By default, the regex is empty, and the original iss will be sent as a tag.
issuerRegex: ${metrics.issuerRegex:}
Abstract Metrics
The AbstractMetricsHandler is an abstract class that cannot be initialized; however, it contains all the shared methods, common tags and metrics registry for other handlers to inject metrics.
Both InfluxDB MetricsHandler and APMMetricsHandler extend from it and share the same configuration file above.
Metrics Injection
When we put a metrics handler in the request/response chain, it will start recording the time when the request reaches it and stop the calculation when the response reaches the metric handler during the response. Additionally, if any error happens within the request/response chain, it will be recorded as well. We call this overall server metrics, which cover most of the use cases for standalone applications.
When we use light-4j as a router or proxy in the http-sidecar and light-gateway, we are also interested in the response time of downstream API calls. In this case, the router handler and proxy handler can collect the time and inject it into the AbstractMetricsHandler.
The following handlers can inject metrics for downstream calls.
egress-router with the metricsInjection configuration flag in the router.yml ingress-proxy with the metricsInjection configuration flag in the proxy.yml lambda-invoker with the metricsInjection configuration flag in the lambda-invoker.yml
Also, there are several external handlers that can inject metrics.
ExternalServiceHandler with metricsInjection configuration flag in the external-handler.yml SalesforceHandler with metricsInjection configuration flag in the salesforce.yml MrasHandler with metricsInjection configuration flag in the mras.yml
Other Implementations
Both InfluxDB MetricsHandler and APMMetricsHandler push the metrics to a remote server or database. We can call them push metrics handlers.
There is another pull metrics handler like Prometheus to expose the API endpoint so that the remote server periodically calls the endpoint to collect metrics.
InfluxDB and Grafana
Here is the docker-compose.yml to start both.
influxdb:
  image: influxdb:latest
  container_name: influxdb
  ports:
    - "8083:8083"
    - "8086:8086"

grafana:
  image: grafana/grafana:latest
  container_name: grafana
  ports:
    - "3000:3000"
  links:
    - influxdb
Metrics Collected
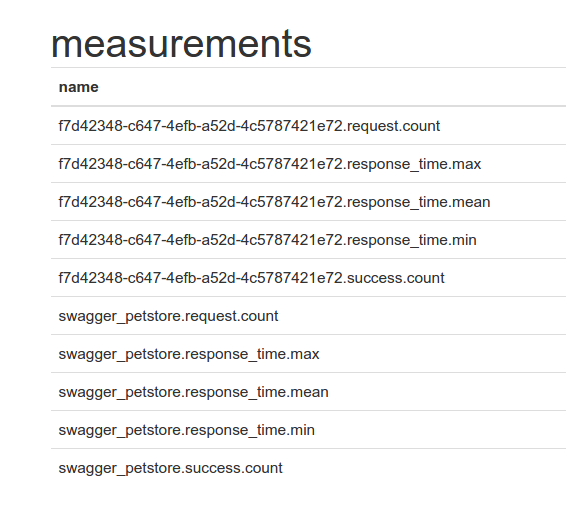
As you can see, there are two perspectives in collecting metrics info. The measurements started with clientId are client centric info and the measurements started with API name are API centric info.
Currently, we are collecting 5 metrics each.
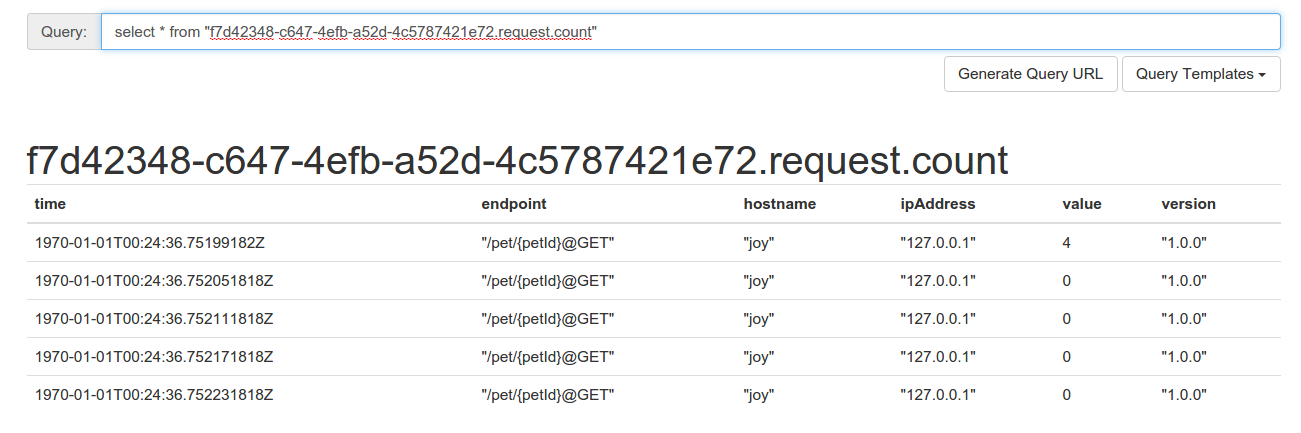
This is the request count for client f7d42348-c647-4efb-a52d-4c5787421e72
The first column is timestamp and value column is the value for this time series. Other columns are tags and they are endpoint, hostname/container id, ipAddress and version.
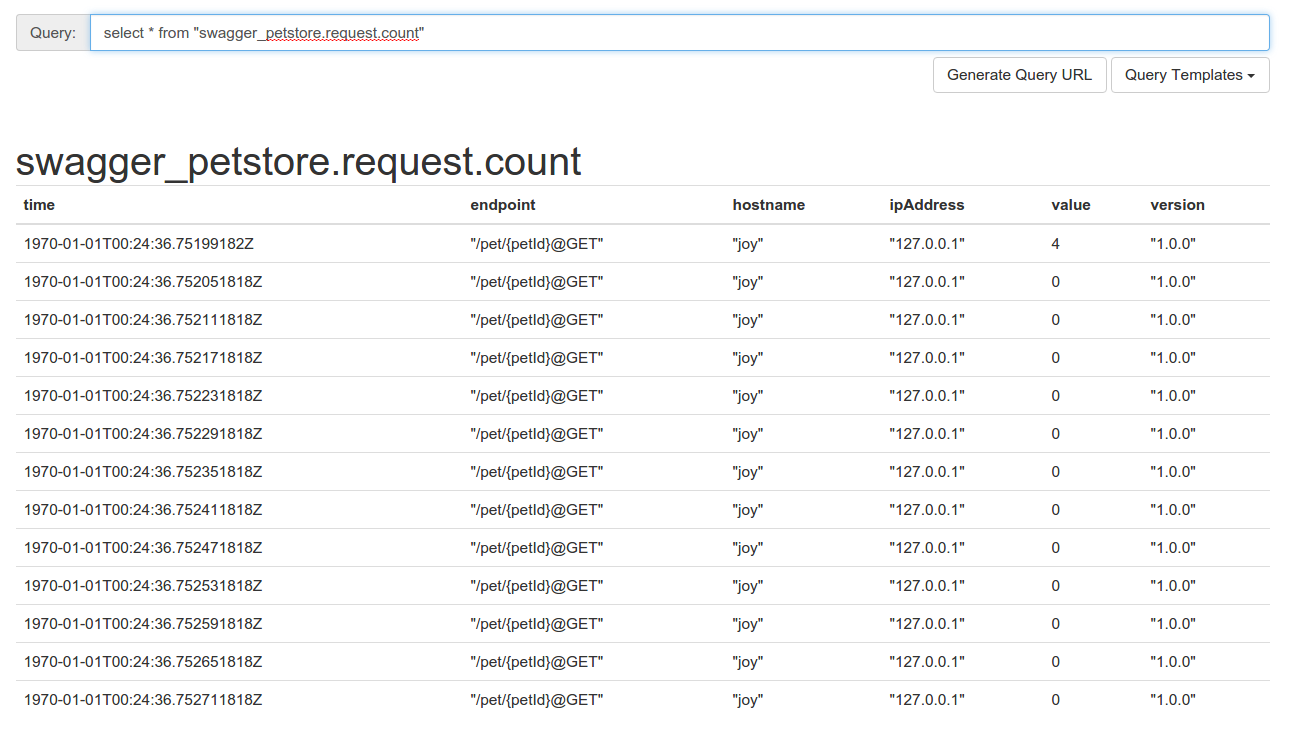
This is a request count for API swagger_petstore.
The first column is the timestamp and the value column is the value for this time series. Other columns are tags and they are endpoint, hostname/container id, ipAddress and version.
Customization
The default implementation is based on InfluxDB and Grafana, which are the most popular combination for docker containers. However, another reporter implementation can easily replace the database and dashboard. To replace it, change the MetricsHandler to use another reporter instead of InfluxDB.
reportInMinutes
In the metrics.yml, you can choose reportInMinutes. The system caches this period, calculates statistical info about the request/response, and reports it to InfluxDB. After the report, the data set is reset to start the collection from scratch. Depending on the performance requirement for your services and your capacity of InfluxDB, you may choose a long or short report period. A short period of 5 minutes will generate more traffic and data to InfluxDB but reduce the chance of data loss when the server is restarting. A long period like 15 minutes, will reduce the load on InfluxDB, and you can keep more days’ data online in InfluxDB to study the long-term trends of your services.